
If you’re new to the crypto and trading industry, then reading crypto charts might sound like an intimidating aspect. That’s why we’re here to help you learn how to read crypto charts and understand the terminology. We’re covering different charts and how to read them along with a beginner’s guide to technical analysis to assist you in making better trading decisions.
Trading Terminology
Before we dive into the concepts, let’s cover the basics. Below are several terms you are likely to come across when learning how to read crypto charts, whether it be for Bitcoin, Tether or Ripple. This terminology is universal to all trading, whether it be stocks, commodities, gold, etc. We’re covering the main types of markets, positions and levels.
Market
Market trends indicate the price movement and market sentiment over a period of time. Traders refer to secular when looking at long periods of time, primary for medium time frames, and secondary for short time frames.
Bear Market – when market prices are on the decline.
Bull Market – when market prices are on the rise.
Positions
Positions are based on actions when it comes to buying or selling crypto. You get long positions and short positions.
Long Position – traders are going to hold for a long time in the view that the price will increase.
Short Position – traders who are “short” sell the asset with the intention of buying it again when the price has lowered.
Levels
When looking at trading patterns, there are support levels and resistance levels. Establishing these levels assists traders in predicting how the market might perform in the long and short term.
Support Level – this indicates when a bear market turns. When the price reaches a certain level, the demand will increase and in turn move the price upward.
Resistance Levels – this is when a bull market turns and the upward trend takes a dive. These levels illustrate demand decreasing as holders sell off to secure gains.
Different Types Of Charts
We’re covering three of the main types of trading charts, looking at what they are and how to read them.
Line Chart
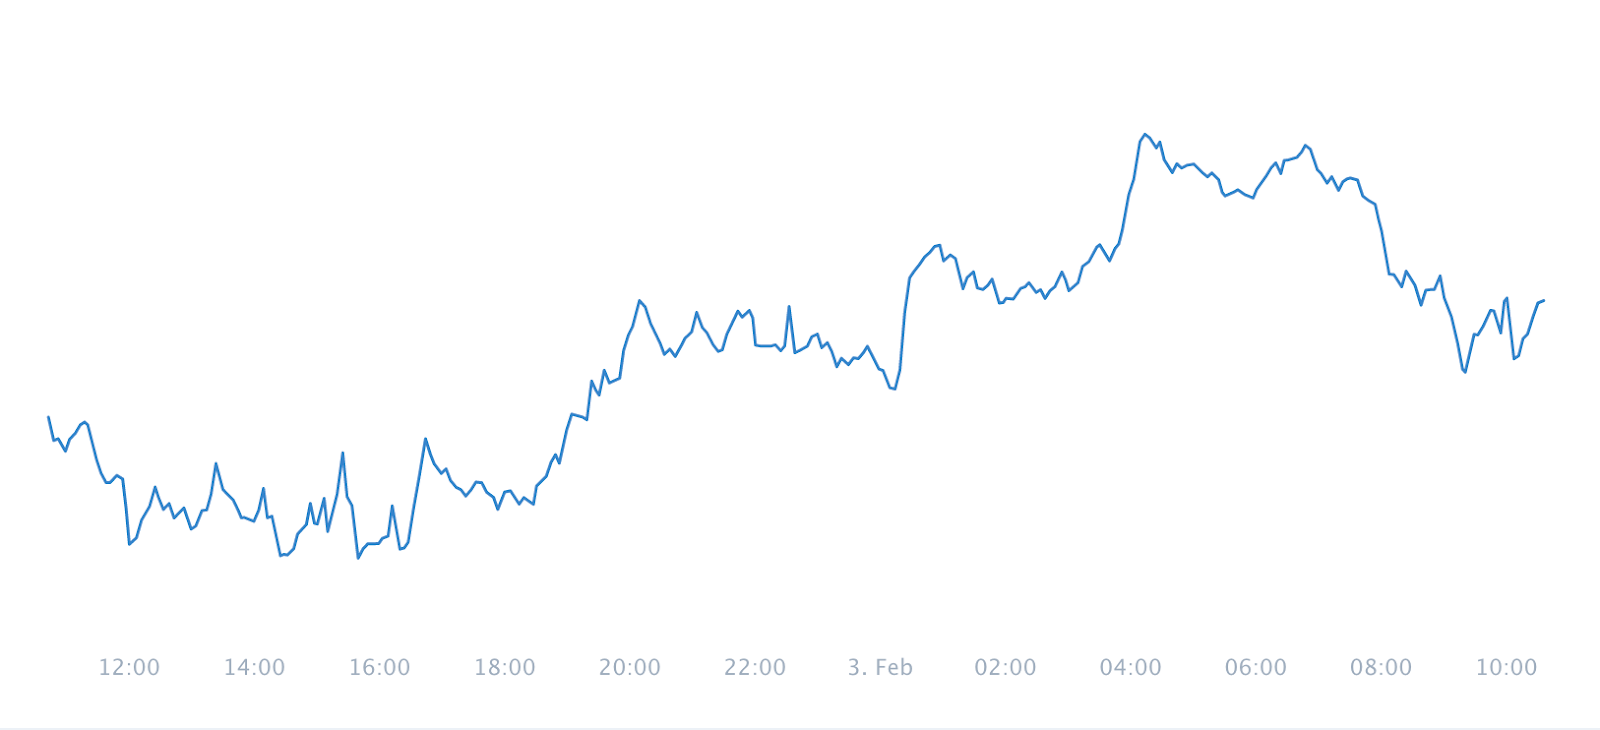
These simple charts offer an overall view of the asset’s price history through a series of lines indicating the movements. The X axis indicates time while the Y axis indicates price. The steeper the line, the stronger the price action. At Oobit we use line charts to indicate the price history of all our cryptocurrencies.
Candlestick Chart
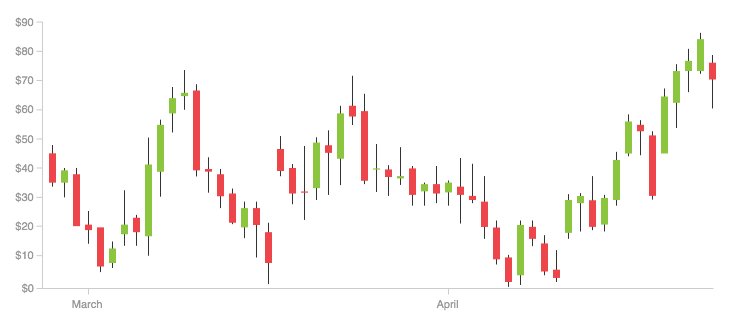
Originating from Japan, candlestick charts get their name from the candle shape that indicates the price movements. These charts offer a lot more information than line charts, but are a little more complicated to read (until now). The candlestick is based on the time frame selected, i.e. if you selected a daily overview then each candlestick will present information for each day.
Each price action is represented by a candlestick, if it is green it means the price went up and if it is red then the price went down. The lines above and below the coloured part indicate the highest and lowest price that it reached during that particular time period. The bottom of the coloured shape indicates the opening price during that time period while the top of the stick indicates the closing price.
Support And Resistance Chart
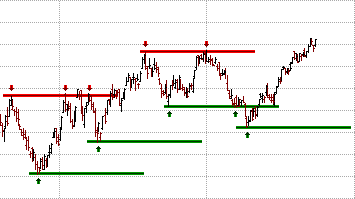
As we discussed earlier, support and resistance levels indicate when the markets take a turn either into a bullish market or a bearish market. Support lines connect all the points where the price previously bottomed out (and bounced upward) indicating that buyers were interested in buying at this price point, and acted upon it. This might be fueled by the low price of the asset and interest in the market. When a support line is drawn across various points and into the future, it indicates to the trader the next time the price might enter a bull market (buyers “support” the price).
Resistance lines work the same, but to stipulate the price at which the bull market will turn. This can be used to indicate when the next bull market might come to an end, and assist traders in acting accordingly. Below you can see the resistance lines indicated in red while the support lines are in green.
Technical Analysis For Beginners
Technical analysis sounds even more frightening than crypto charts, but don’t be put off by the name. Technical analysis is just a fancy way of reading the charts with various different tools to determine what might happen next based on historical price points. Here are two of the more simpler and popular options:
Moving Averages
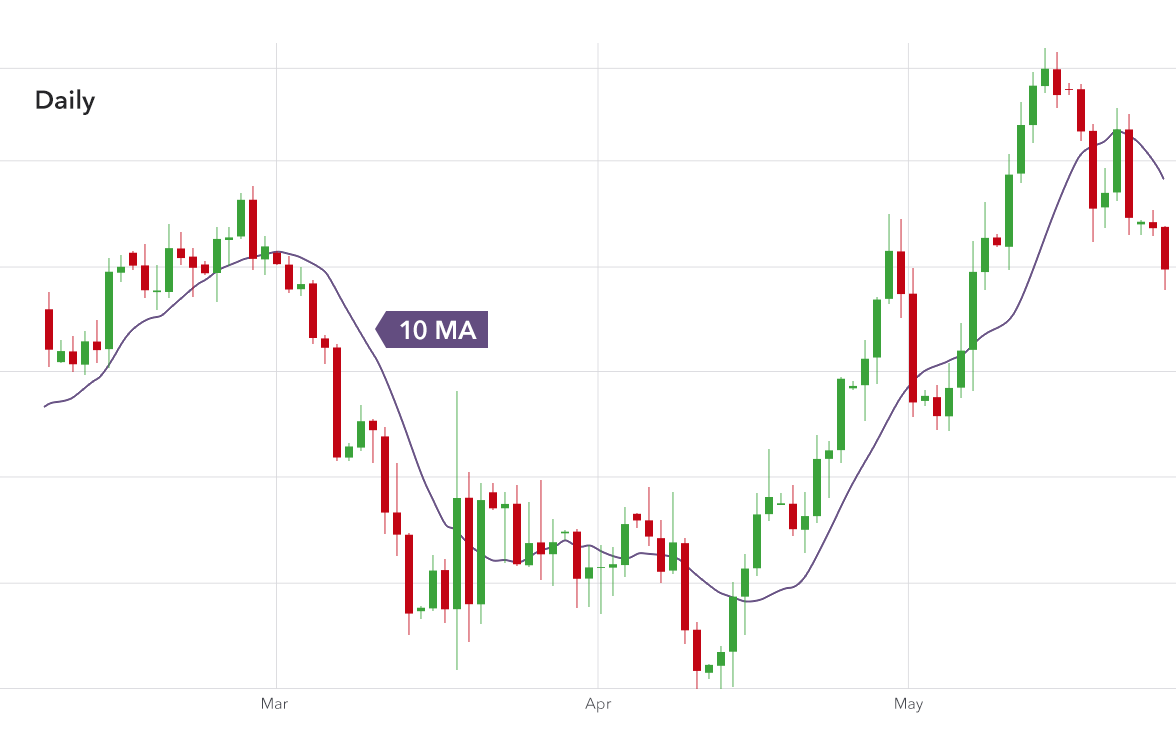
Moving averages are smoother lines drawn over trading activity that illustrate overall trends. It indicates the average price action history. These give an overall view as opposed to a run by run account of every small price incline and decline.
At various intervals the average price is determined, and then these data points are connected to indicate the moving average.
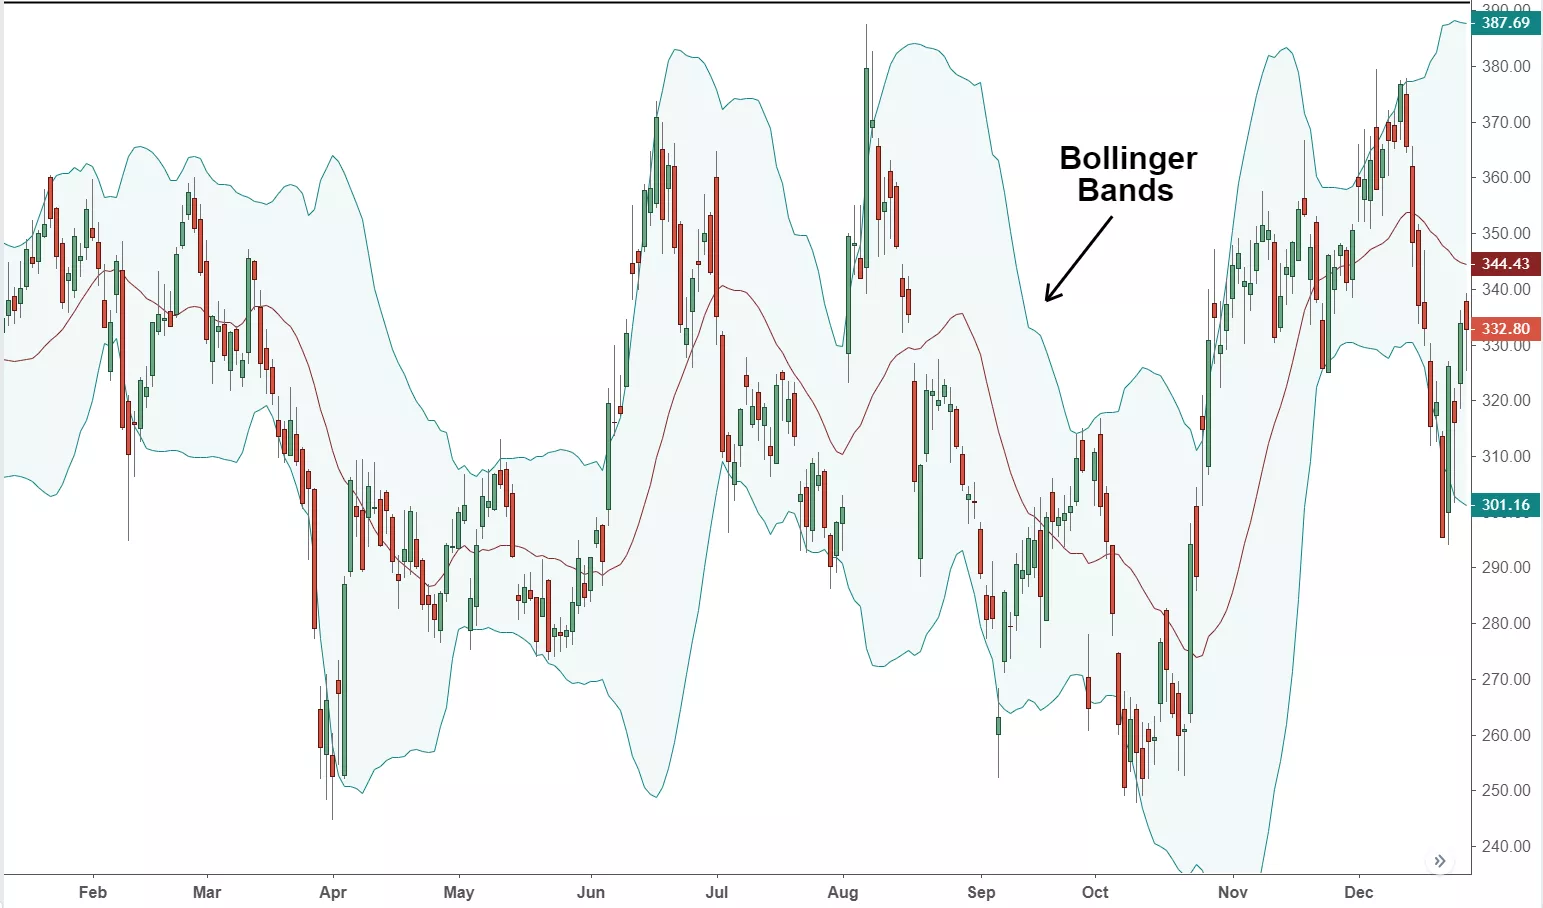
Bollinger Bands
Bollinger Bands involve the use of three lines, one of them being a MA (moving average). This method was designed by a famous technical trader, John Bollinger, to indicate to traders when an asset is overbought or oversold.
How To Read Crypto Charts
Well done, you’ve officially graduated from our class on how to read crypto charts. The more you use these terms and read about them, the more used to them you’ll become and the more confident using them. More is less in this case.
Whether you enjoy buying and selling or buying and holding, crypto charts can offer you valuable insight into where the markets might be going. At Oobit, you can buy and sell a range of cryptocurrencies like Bitcoin (BTC), Ethereum (ETH), Tether (USDT), Ripple (XRP), and more. Get started with as little as $20 and pay easily with a credit card, debit card, or bank account.
_______________________________________________________
Oobit Technologies Pte, 50 Raffles Place #37-00 Singapore Land Tower, Singapore (048623). is a company registered in Singapore (no:201716443G), that has been approved as Appointed Representative of Oobit Technologies OÜ, Harju maakond, Tallinn, Lasnamäe linnaosa, Väike-Paala tn 2, 11415, (no: 14852617 ). Which is authorized and regulated by the FIU (no: FVR001421 and FRK001304).